Vision Language Model Evaluation & Inspection Made Easy
From loss curves to GGUF exports – mastering your vision language model evaluation workflow with built-in metrics.

Anyone who has trained a large language model or a vision language model eventually reaches the same conclusion: it is incredibly difficult to tell if the model is actually working correctly.
The evaluation process is notorious for being complex and time-consuming. You need to prepare various datasets, compute metrics, interpret the results, and ultimately make a high-stakes decision: is this model truly ready for production? To make matters worse, LLMs can suffer from catastrophic forgetting during training – losing critical baseline knowledge even when their initial results look great at first glance.
In this guide, I walk through the full workflow: loss curves, dataset analytics, text metrics, and sample-level inspection. Let’s delve into it!
Part of a Series: Fine-Tuning and Evaluating Vision-Language Models
Recently, we introduced a system for fine-tuning Vision-Language Models (VLMs). If you are starting here, I recommend reading the previous guides first:
- How to Fine-Tune a Vision Language Model Without Writing Code – an introduction to VLM fine-tuning without any coding required.
- Fine-Tuning a Vision Language Model With the Ximilar API (Part #1) – a comprehensive walkthrough of building and fine-tuning a vision-language model via the Ximilar app and API.
Today, we’re diving deep into the model I built in Part 1 to see how it actually performs.
Navigating Trained Models in the Ximilar AI Platform
Each Task detail contains the training configurations for your LLM or VLM, as well as the Models table.
This table displays up to the last 5 trained models and serves as your quick-reference dashboard. At a glance, you can track:
- Version & Creation Date: Know exactly when each iteration was built.
- Status & Progress: See if a model is successfully trained, still processing (with a live progress bar), or if the training failed.
- Token Accuracy: Your primary indicator of how well the model is learning.
- Actions: Quick-access buttons to download the model, activate it as your default version, or dive deeper into the training metrics.
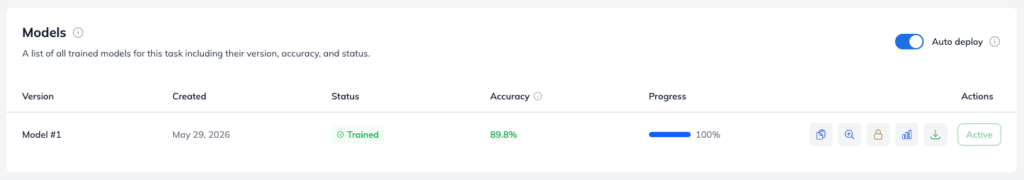
To see a detailed breakdown, click the magnifying glass icon next to any model. This redirects you to the Trained Model Page, which functions as your primary evaluation dashboard.
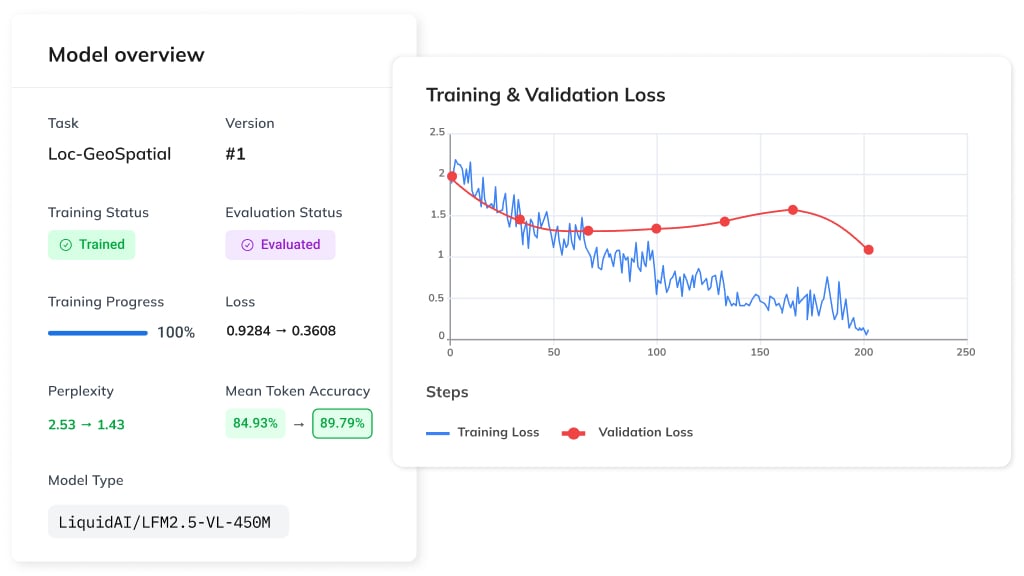
Model Overview – Architecture of LLM, Loss & Perplexity
At the top of the Model Detail, the Model Overview gives you a global snapshot of your training performance. Ideally, you want to see a clear trend: as Token Accuracy increases, your loss function and perplexity should drop. This inverse relationship confirms your training is on the right track.
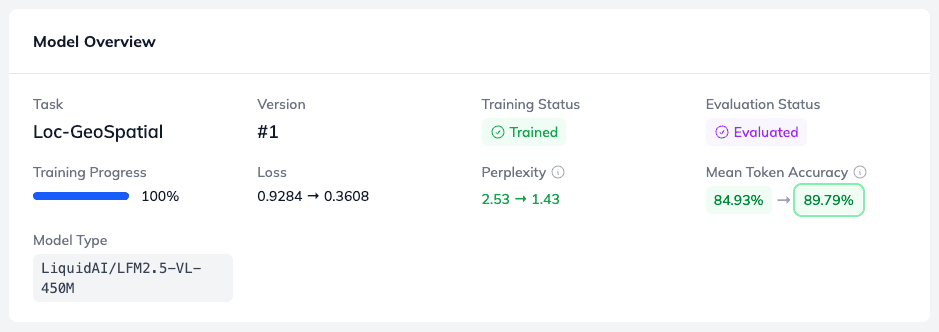
As you can see, the model type for this task is LiquidAI/LFM2.5-VL-450M. This is a highly efficient Liquid Foundation Model (LFM) from Liquid AI, engineered to cost-effectively process multimodal tasks involving both visual and textual information.
Above the Model Overview, you’ll find a simple toggle: Validation | Test. If your datasets contain samples flagged for testing, you can evaluate your model’s performance on this independent test set. These test samples are completely held out and never seen during the LLM finetuning cycle. If you’ve previously trained a classification or detection model in Ximilar, you’ll find this workflow exactly the same.
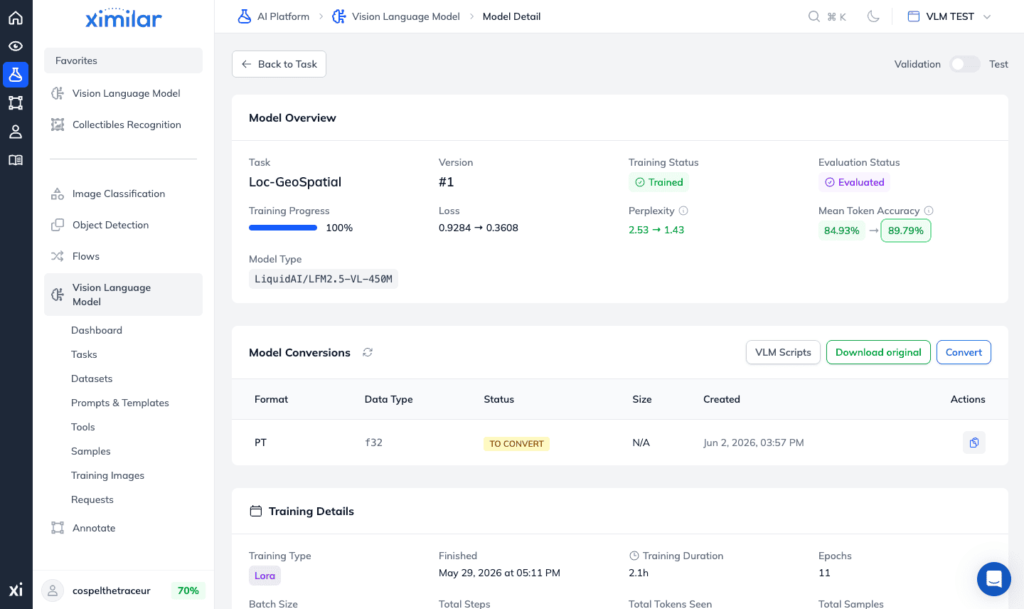
Exporting Your Model for llama.cpp and Transformers Libraries
Directly below the overview, you will find the Model Conversions section. While this table is usually empty by default, initialising a conversion allows you to export your newly trained model so you can run it locally on your own hardware.
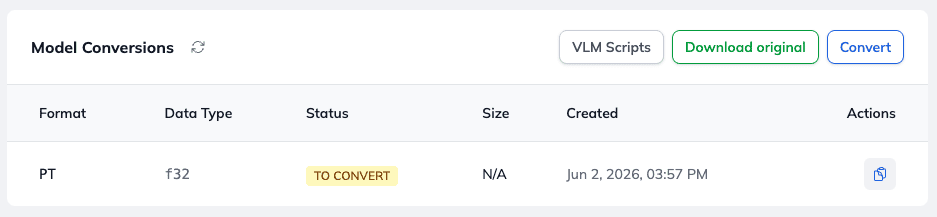
The platform supports flexible export formats to fit your deployment needs:
- PyTorch Weights – The standard format, perfect for traditional Python environments and further development.
- GGUF Format – Ideal for local CPU/GPU inference via
llama.cppor Ollama, giving you highly optimized local execution.
Training Details – Numbers Behind Your Fine-Tuning Run
The Training Details panel provides a transparent look at the core mechanics of your training run, including:
- Epochs – The total number of complete passes through your training dataset.
- Total Samples – The total volume of data used to train the model.
- Token Count – The cumulative number of tokens the model processed during the session.
- Duration – Exactly how long the training took from start to finish.
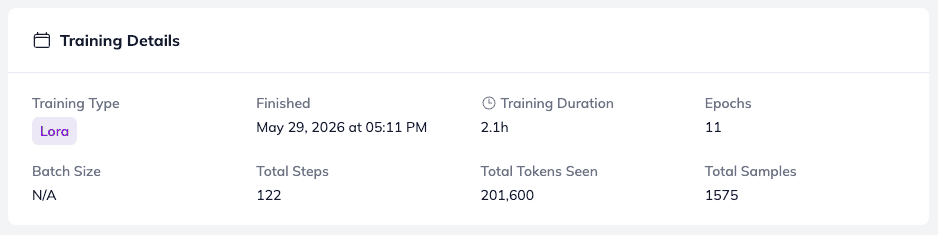
📊 Note on Optimization: Because this run was configured for efficient fine-tuning rather than full optimization, the architecture utilized LoRA (Low-Rank Adaptation). This allows for rapid, lightweight training without rewriting the base model’s entire weight matrix.
Analyzing Training Loss and Dataset Distribution
Next, the platform maps out your Training Loss History alongside the number of training samples.
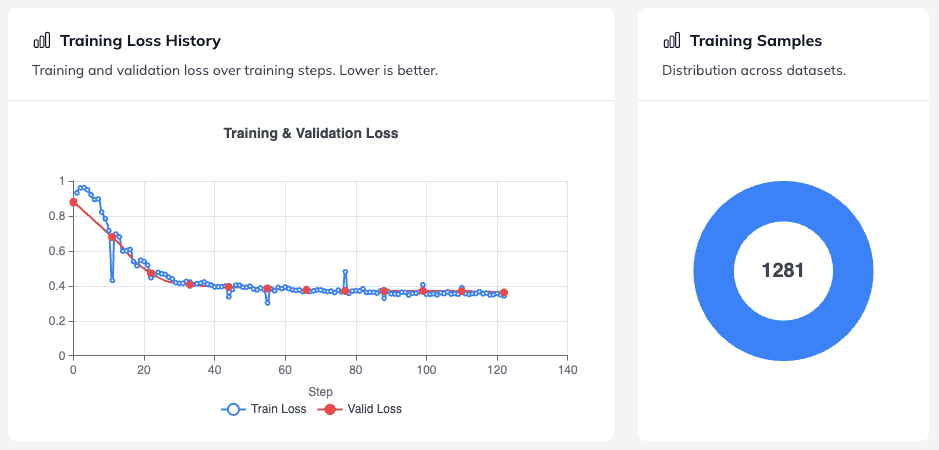
Dataset Sample Distribution – if your task relies on multiple combined datasets, this view is incredibly useful. It shows you the exact distribution of samples across your different data sources, helping you ensure your data set is balanced and that no single source dominates training.
The Loss Curve – in this run, the loss function decreases steadily over the course of its 120 training steps. A consistently downward-sloping curve is a strong sign that the model is actively learning without hitting a premature plateau. Monitoring this curve is one of the most reliable ways to assess progress during fine-tuning before running any formal benchmark.
Dataset Performance Analytics and Fine-Grained Evaluation
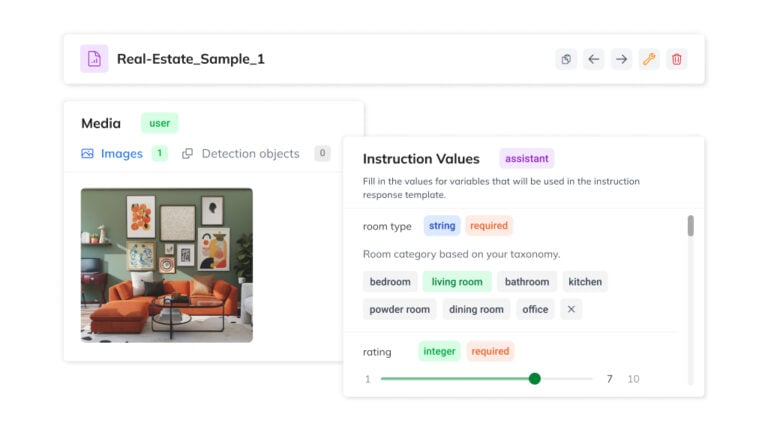
The Dataset Performance section is one of the most powerful tools available for vision-language model evaluation at the variable level. Because the Ximilar platform uses a structured template format for multimodal training, the system can assess exactly how your model performs when generating values for individual variables.
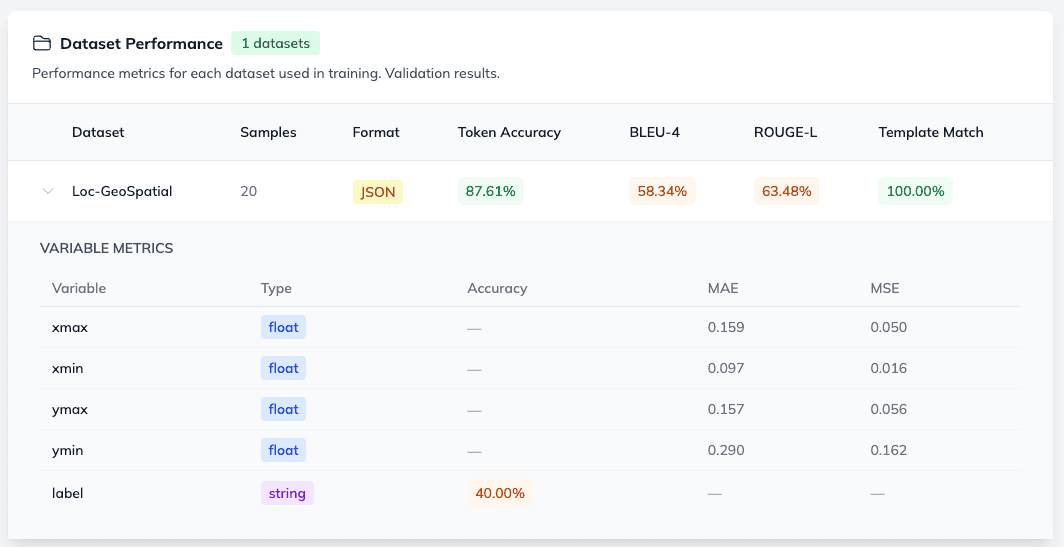
For example, our template format for object detection looks like this:
[{"label": "{{label}}", "bbox": [{{xmin}}, {{ymin}}, {{xmax}}, {{ymax}}]}]In this setup, we are tracking a string (label) and four float variables representing our bounding box coordinates (xmin, ymin, xmax, ymax). This is a common pattern in computer vision tasks such as object detection, segmentation, and image retrieval – areas where computer vision and pattern recognition methods meet language-driven annotation.
For these float variables, the platform automatically computes two critical error metrics:
- MSE (Mean Squared Error) – Highlights larger errors by squaring the differences, helping you spot major coordinate deviations.
- MAE (Mean Absolute Error) – Measures the average magnitude of the errors, giving you a clear picture of overall bounding box accuracy.
Evaluating vision-language models at the sample level is what separates a model that looks good on paper from one that is genuinely production-ready.
This fine-grained, variable-level tracking is an invaluable feature for managing, debugging, and evaluating custom data sets during instruction fine-tuning. The annotation quality of your training data directly influences these scores, so this view is also useful for identifying labelling inconsistencies.
Overall Text Evaluation Metrics: Before vs. After Fine-Tuning
Moving down the page, the Overall Text Metrics section evaluates performance at the text-generation level.
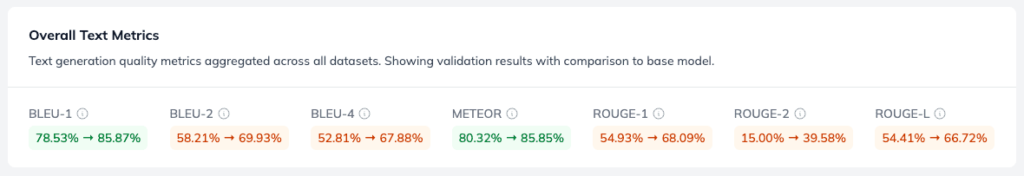
What makes this view truly unique is that it displays both pre-training and post-training statistics side-by-side. This allows you to quantify exactly how much your model improved after fine-tuning – a key step in any rigorous evaluation of vision-language models.
The platform tracks three industry-standard natural language processing (NLP) evaluation metrics:
1. BLEU (Bilingual Evaluation Understudy)
- What it measures: Precision – how many words in the generated text appear in the reference text.
- The Breakdown: The platform tracks BLEU-1 (unigram/single words), BLEU-2 (bigram/two-word phrases), and BLEU-4 (4-gram/four-word phrases) to analyze text quality at different structural levels.
- Originally developed for machine translation, BLEU is now widely used as one of the standard metrics used to evaluate generative language model output, including image captioning tasks where generated captions must closely match reference text.
2. ROUGE (Recall-Oriented Understudy for Gisting Evaluation)
- What it measures: Recall – how much of the reference text the model successfully captured in its generation.
- The Breakdown: It tracks ROUGE-1 (unigram overlap), ROUGE-2 (bigram overlap), and ROUGE-L (the Longest Common Subsequence), which helps evaluate how well the model maintains sentence flow.
- ROUGE is especially relevant for vision-language tasks like VQA (visual question answering) and image captioning where output completeness matters as much as precision.
3. METEOR (Metric for Evaluation of Translation with Explicit Ordering)
- What it measures: Balanced precision and recall, but with a twist – unlike BLEU and ROUGE, METEOR factors in synonyms and stemming (e.g., matching “run” with “running”).
- This semantic awareness makes it behave much more like a human evaluator and is particularly useful when assessing natural language generation robustness across various data sets, including those with multilinguality or diverse phrasing styles.
Debugging VLMs with Best and Worst Performing Samples
The Best and Worst Performing Samples section offers a highly practical window into actual model behaviour.
Instead of forcing you to deploy the model and run manual inference tests, the platform automatically surfaces up to 5 samples per connected dataset. This allows you to directly compare the model’s raw output against your annotated ground truth.
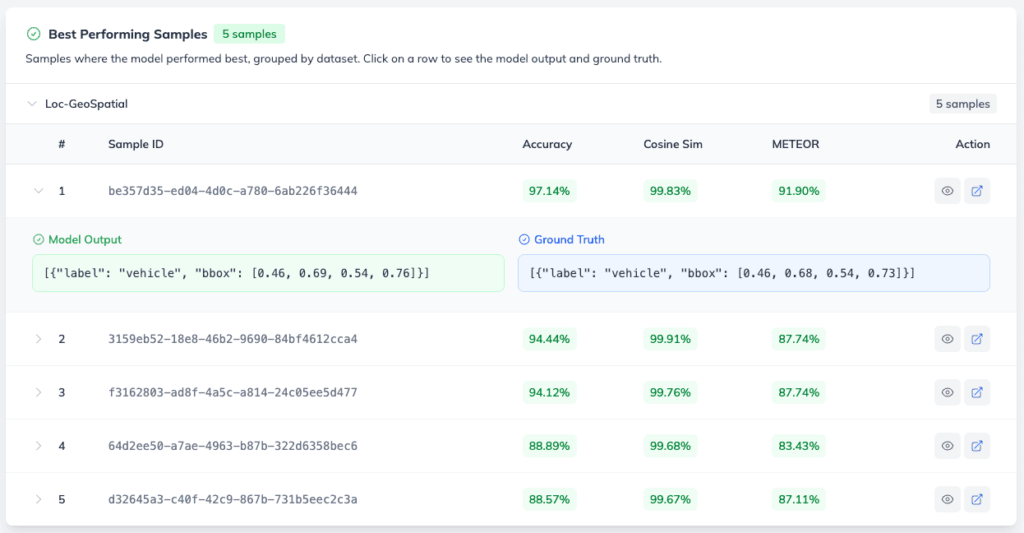
This is especially useful for catching failure modes that aggregate metrics can miss. A high average BLEU score can hide a handful of completely wrong predictions – worst-case samples reveal exactly where your model’s visual perception or textual understanding breaks down, and which parts of your data set may need better annotation or more training examples. Evaluating vision-language models at the sample level is what separates a model that looks good on paper from one that is genuinely production-ready.
Tracking Configurations and Image Augmentations
The final component on the page is Model Configuration. This acts as your historical record, documenting the exact parameters and image augmentation settings used for this specific training run.
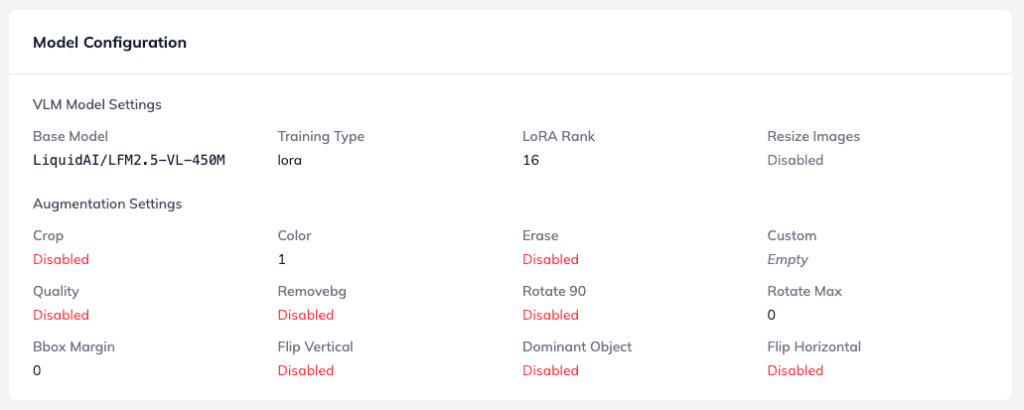
This log is invaluable when you are training multiple versions of a model and want to experiment with different setups, such as:
- Hyperparameters – Quickly verifying learning rates, batch sizes, or LoRA configurations.
- Image Augmentations – Checking how adjustments to brightness, cropping, rotation, or color flipping impact your final vision-language model performance. These machine learning algorithms for data augmentation can have a significant effect on how well the model generalises to unseen images and videos.
Having this data tethered to your evaluation metrics makes it easy to pinpoint exactly which configuration tweak led to your highest-performing model. It also serves as a living benchmark of your own fine-tuning experiments over time – especially useful when testing robustness across different augmentation strategies or large datasets.
Ready to Build Your Own VLM?
Evaluating vision-language models and fine-tuning them doesn’t have to be a black box. With Ximilar’s robust tracking tools, model configuration logging, and seamless local exports to open-source formats like GGUF and PyTorch, you have everything you need to build production-ready AI for vision-language tasks.
Sign up for a free Ximilar account today or reach out to our team to start training and evaluating your own custom VLMs with precision. You can also explore our vision-language model platform for a full overview of supported model types and deployment options, including image captioning, VQA, object detection, and retrieval.

Tags & Themes
Related Articles
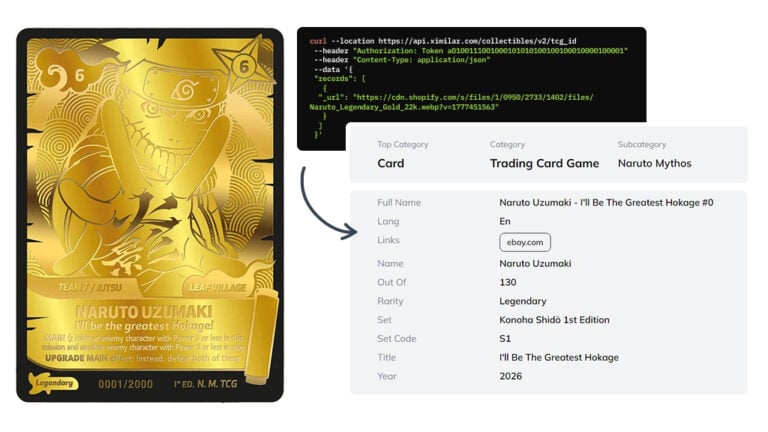
Naruto Mythos Card Recognition – Now in Our TCG AI
Ximilar’s card recognition AI now identifies English Naruto Mythos TCG cards – name, set, rarity, and other details returned directly from the API.

Duel Masters Card Recognition – Now in Our TCG AI
Our card recognition AI now scans and identifies Japanese Duel Masters trading cards in a single REST API response.
How to Build & Manage Instruction Datasets for LLM Fine-Tuning
A complete guide to creating high-quality instruction-tuning data for fine-tuning Large Language Models (LLMs) and Vision Language Models (VLMs).